As noted in the methodology for each, there's a small amount of fuzziness in some of the numbers for a couple of reasons, the main one being that the "as of" date varies depending on the type of coverage--Medicaid/CHIP total numbers are as of last October, while ACA Expansion Medicaid is as of last June; Medicare data is as of September 2024; and ACA exchange QHPs/BHPs are as of January 2025.
But actually, he thought as he re-adjusted the Ministry of Plenty’s figures, it was not even forgery. It was merely the substitution of one piece of nonsense for another. Most of the material that you were dealing with had no connexion with anything in the real world, not even the kind of connexion that is contained in a direct lie. Statistics were just as much a fantasy in their original version as in their rectified version. A great deal of the time you were expected to make them up out of your head.
For example, the Ministry of Plenty’s forecast had estimated the output of boots for the quarter at 145 million pairs. The actual output was given as sixty-two millions. Winston, however, in rewriting the forecast, marked the figure down to fifty-seven millions, so as to allow for the usual claim that the quota had been overfulfilled. In any case, sixty-two millions was no nearer the truth than fifty-seven millions, or than 145 millions.
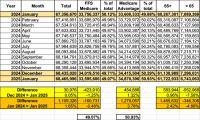
So far, after a 2-month initial delay, the Musk/Trump Regime has been posting updated Medicare enrollment data roughly once per month. We'll see if that continues.
Whether the data posted since January 20, 2025 is accurate or not, I can't say for certain, but at least they're updating it...and so far, at least, I don't see anything in their November 2024, December 2024 or January 2025 reports which is setting off any obvious red flags.
As of this writing, the same can't be said for the monthly Medicaid/CHIP enrollment reports, which are usually updated the same day as the Medicare reports, but which have remained stuck on October 2024 since before Trump was inaugurated in January.
In any event, according to the latest report, as of January 2025:
On March 30, 2023, a federal district court judge issued a sweeping ruling, enjoining the government from enforcing Affordable Care Act (ACA) requirements that health plans cover and waive cost-sharing for high-value preventive services. This decision, which wipes out the guarantee of benefits that Americans have taken for granted for 13 years, now takes immediate effect.
As you can imagine, this has been a monumental task; not only did I have to crunch a lot of data to break out the statewide numbers into House district-level estimates, I also had to convert that data into nearly 480 easy-to-read graphics...and then I doubled my workload by going one step further and adding high-res PDF versions for folks to print out in large format for town halls, rallies and #HandsOff protests nationally.
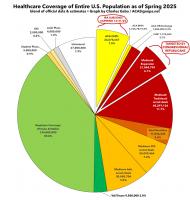
With the pending dire threat to several of these programs (primarily Medicaid & the ACA) from the House Republican Budget Proposal which recently passed, I'm going a step further and am generating pie charts which visualize just how much of every Congressional District's total population is at risk of losing healthcare coverage.
USE THE DROP-DOWN MENU ABOVE TO FIND YOUR STATE & DISTRICT.
On Monday, Gov. Dan McKee said his team has identified 650,000 people whose personal information was stolen in the recent cyberattack on the state’s IT system for social services.
...Earlier this month, the cyberattack shut down the state’s IT system known as RIBridges, which serves as an eligibility database for a host of social services, such as SNAP and Medicaid, along with subsidized health insurance through HealthSourceRI.
...According to McKee, the state aims to turn the system back on in January. In the meantime, R.I. Human Services Director Kim Merolla-Brito said people will still receive benefits through SNAP, Medicaid and other cash-assistance programs. She said EBT cards should be refilled for January under normal distribution methods.
She added that nobody will be terminated from Medicaid while the system is down.
Every year around this time I start my annual individual & small group market rate filing analysis project. This involves spending months painstakingly tracking every insurance carrier rate filing for the upcoming year to determine just how much average insurance policy premiums on the individual market are projected to change.
Carriers tendency to jump in and out of the market, repeatedly revise their requests, and the confusing blizzard of actual filing forms sometimes make it next to impossible to find the specific data I need.
The actual data I need to compile my estimates are actually fairly simple, however. I really only need three pieces of information for each carrier: How many effectuated enrollees they have in ACA-compliant policies this year; the average projected rate change for those policies; and, ideally, a breakout of the rationale behind the changes.
Usually the reasons given are fairly vague things like "increased morbidity" (ie, a sicker risk pool) or the like. Sometimes, however, there's a very specific reason given for some or all of the premium changes. Major examples of this include: