

CMS releases monthly effectuation data; some interesting patterns emerge...
Thu, 07/04/2024 - 3:58am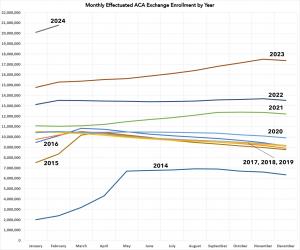
Along with posting detailed data on February effectuated enrollment by state since 2017 yesterday, the Centers for Medicare & Medicaid Services (CMS) also included a spreadsheet with monthly effectuated enrollment broken out by state for every year since 2016.
While it's unfortunate that neither 2014 nor 2015 were included, I have partial data for the first two years of the ACA exchanges from a similar post I put together back in 2019.
It's important to understand the difference between someone selecting a Qualified Health Plan (QHP) from one of the ACA exchanges during the Open Enrollment Period and someone actually being enrolled in an effectuated policy...that is, just because you sign your family up for a policy on HealthCare.Gov or a state-based exchange, you aren't considered effectuated until you actually pay your first monthly premium.
In addition, some people only pay for a few months before dropping their exchange coverage. There are any number of legitimate reasons for this--some turn 65 and move to Medicare. Some fall on hard times and transfer over to Medicaid. Some get a job with benefits. Some might get married and move onto their spouse's employer coverage. Some...die (hey, it happens).
At the same time, there are some people who enroll during the off-season via Special Enrollment Periods (SEPs) for similar reasons to the ones I listed earlier: Having a baby, getting married/divorced, moving to a new town/state, turning 26 (thus being kicked off your parents' employer plan), losing a job with benefits, losing Medicaid/CHIP coverage due to your income rising above the maximum eligibility threshold and so on.
For the past year or so, this last reasons--having your Medicaid/CHIP coverage terminated--has been a major one, with nearly 4.8 million Americans shifting from Medicaid/CHIP to ACA exchange plans from May 2023 - March 2024.
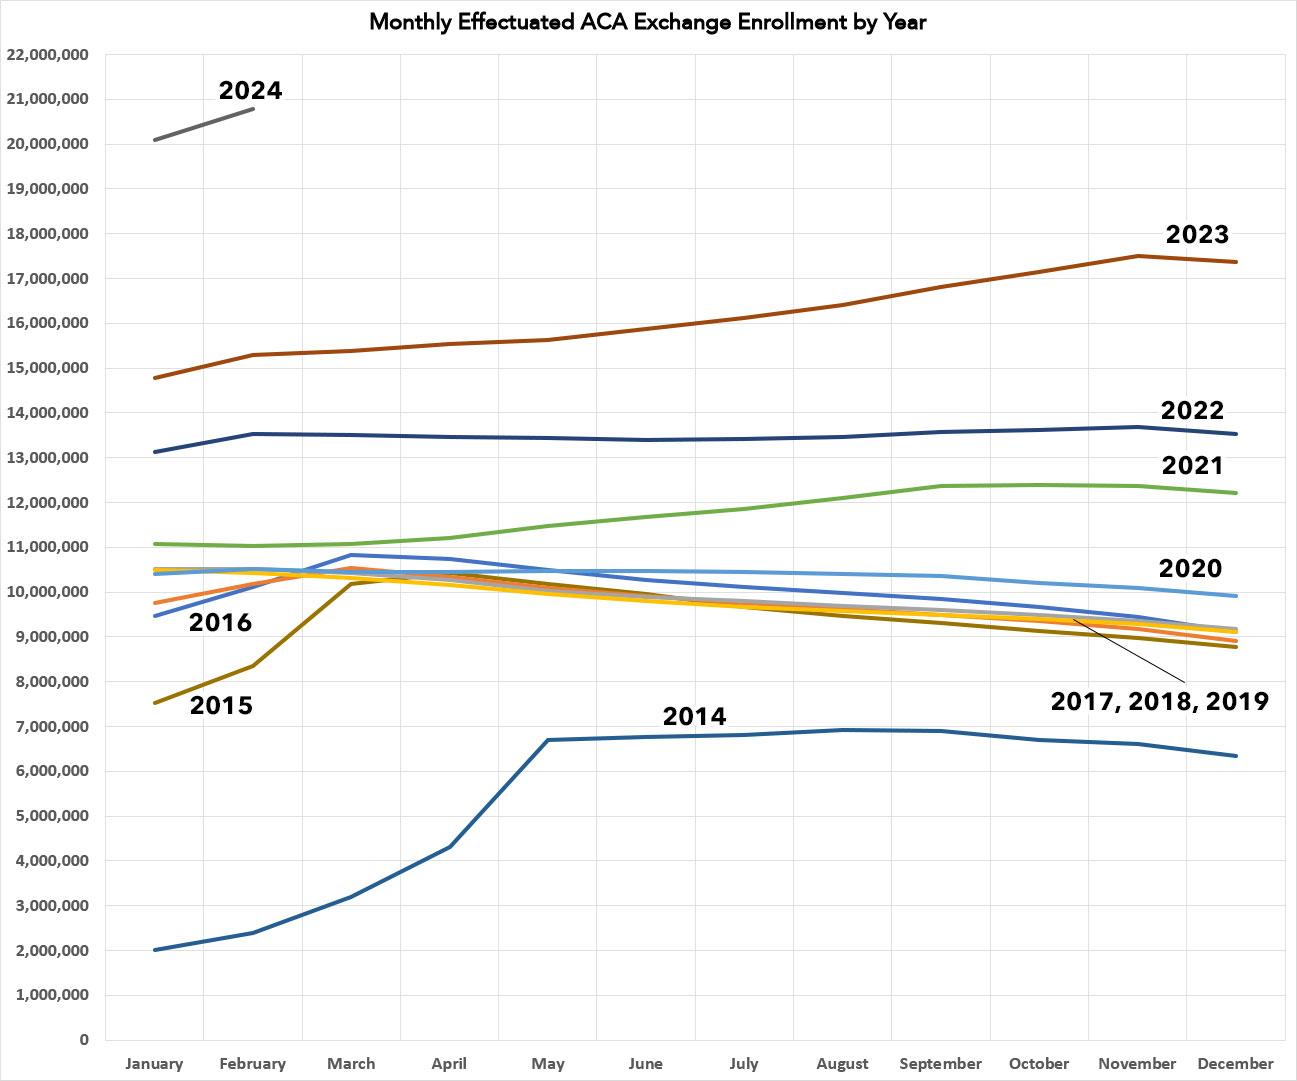
When you overlap the monthly effectuated enrollment for each year out on a graph as I've done below, some interesting patterns emerge. Remember, none of the data/analysis below includes OFF-exchange individual market enrollments, which are a whole different discussion. Everything here is ON-exchange enrollees only.
The first ACA Open Enrollment Period, from October 2013 - March 2014, was infamously insane. Between massive technical glitches, a government shutdown, a public completely new to the concept and confused news media coverage, it's amazing in retrospect that it ended up being as successful as it was in the end. The first OEP ran for 6 full months, and in fact it was actually 6 1/2 months since the final deadline was bumped out by 2 extra weeks due to the technical problems at launch.
As a result, the enrollment numbers were heavily skewed to March and the first half of April, making for a dramatic effectuation surge in spring 2014, followed by it plateauing for most of the year before gradually dropping off in the final months.
2015 and 2016 saw the OEP cut in half to just three months (November - January), although the starting & ending dates shifted around slightly. This caused similar but far less dramatic mini-surges over the first quarter of the year, followed by a gentle attrition rate over the next nine months.
Over the next four years (the Trump Administration), the Open Enrollment Period was cut in half again to just 45 days, from November 1st - December 15th. This caused the monthly effectuation rates to be far less interesting, since practically everyone who was going to enroll for the year had already done so as of January 1st. The attrition rate followed pretty much the same pattern, however. 2020 stood out somewhat, with a much milder attrition rate over the course of the year, likely due to us being in the thick of the COVID pandemic at the time.
Once 2021 rolled around, however, things started to change dramatically. The actual OEP itself was still only 45 days long, but Congress passed the American Rescue Plan which dramatically boosted ACA subsidies as well as expanding them to middle class enrollees (making the upgrade retroactive to the first of the year), and the Biden Administration re-opened enrollment for awhile after the official deadline. Those enhanced subsidies would be furhter
Both of these changes in light of the ongoing pandemic not only caused initial effectuated enrollment to jump ahead of any previous year, but also resulted in effectuations increasing as each month passed through October before starting to drop slightly at the tail end.
2022 and 2023 saw even more dramatic enrollment and effectuation spikes, as the enhanced subsidies were now firmly baked into the system and other changes by the Biden Administration (increased navigator & outreach funding, the closure of the Family Glitch, etc) went into effect. In addition, several individual states including New Mexico and especially Texas implemented robust Premium Alignment pricing policies, and a dozen states either implemented or significantly upgraded their own state-based supplemental financial subsidies.
Meanwhile, the Inflation Reduction Act extended those enhanced federal subsidies through the end of 2025.
2023, in particular, saw a further surge in effectuated enrollments over the second half of the year due to the Medicaid Unwinding process kicking into gear, bringing millions of Medicaid enrollees over to ACA exchange plans.
Finally, you can see 2024 in the top left corner. While we only have 2 months of data for this year so far, the effectuated enrollment numbers tower over every other previous year. It will be interesting to see how this plays out over the rest of the year, considering that the still-happening Unwinding process has mostly tapered off.

Advertisement