

CMS confirms *effectuated* ACA enrollment *and* "How Many Have Paid?" are at all-time highs: 20.8M enrolled, 97% retention rate!
Wed, 07/03/2024 - 10:53pm
Earlier this afternoon, the Centers for Medicare & Medicaid Services (CMS, which should really be CMMS) released a whole bunch of much-awaited (by healthcare wonks) Effectuated Enrollment data for Affordable Care Act on-exchange enrollment.
While nearly 21.5 million Americans selected Qualified Health Plans (QHPs) via the federal and state ACA exchanges/marketplaces during the official 2024 Open Enrollment Period (along with an additional 1.3 million signing up for a Basic Health Plan (BHP) program in New York & Minnesota, which CMS continues to inexplicably treat as an afterthought in such reports), not all of them actually pay their first monthly premium (for January) for various reasons:
- In some cases there may be residency documentation verification issues;
- In some cases there may be technical glitches which prevented their enrollment from being effectuated;
- In some cases they may have found some other type of healthcare coverage (i.e., a job offer with healthcare benefits came through at the last minute, so instead of cancelling their enrollment they just didn't bother paying the premium & were removed from the roles)
A decade ago, during and immediately after the first, batshit insane Open Enrollment Period which ran for 6 1/2 months from October 2013 - mid-April 2014, Congressional Republicans were obsessed with the idea that vast numbers of "Obamacare" enrollees were phantoms--that is, that either the Obama Administration was flat-out making them up or that millions of people were "signing up" for exchange policies but never actually paying for it or having their policies go into effect.
This became a bit of a running joke at the time...
A hardy perennial now enjoying a revival is the “How many have PAID???” freakout. Independent ACA statistics tracker Charles Gaba has put this one under his microscope. His conclusions are that, first of all, the issue is probably exaggerated and, second, it’s way premature even to count nonpaying enrollees, because many of them won’t even receive bills for weeks yet. (We’re indebted to Gaba for the triple-question marks in our headline, as well as for resurrecting the useful term “freakout.”)
It got so out of hand that the then GOP-controlled House Energy & Commerce Committee (which was chaired at the time by Republican Representative Fred Upton from here in Michigan) actually sent out a (deeply flawed) survey to a bunch of insurance carriers demanding to know how many ACA exchange enrollees had actually paid their first premium. They then posted the results of their "survey" and attempted to make a huge stink about how, supposedly, only 67% of enrollees had done so.
I tore their survey and press release to shreds at the time by noting obvious flaws like the fact that the 67% figure assumed that all enrollees as of 4/15 were supposed to be due by 4/15 (in fact, only about 63% of the total enrollments were due by 4/15; the rest weren't due until April 30th...the same day of the press release. Of course there's also the minor detail that the survey itself was sent out on March 13th, even though, again, around 40% of enrollees for 2014 didn't even sign up until after March 15th.
When the dust settled, it turned out that somewhere around 85% or more of enrollees did indeed pay up for at least the first month, though this varied by state and carrier.
Over the years, as the federal & state exchange systems have improved and streamlined their enrollment processes and the ACA enrollment system has settled down and largely standardized itself, the percent of enrollees who make that critical first premium payment has increased, to the point that as of 2018, around 90% were doing so.
Since then, the biggest major upgrades in the ACA as a whole have been the dramatic improvement in the financial subsidy formula thanks to the American Rescue Plan and Inflation Reduction Act, as well as the implementation of the so-called "Silver Loading" pricing strategy in numerous states. Both of these have combined to offer zero premium healthcare plans to many ACA enrollees...and of course it's a lot easier to get people to pay their premium each month if that premium is nothing.
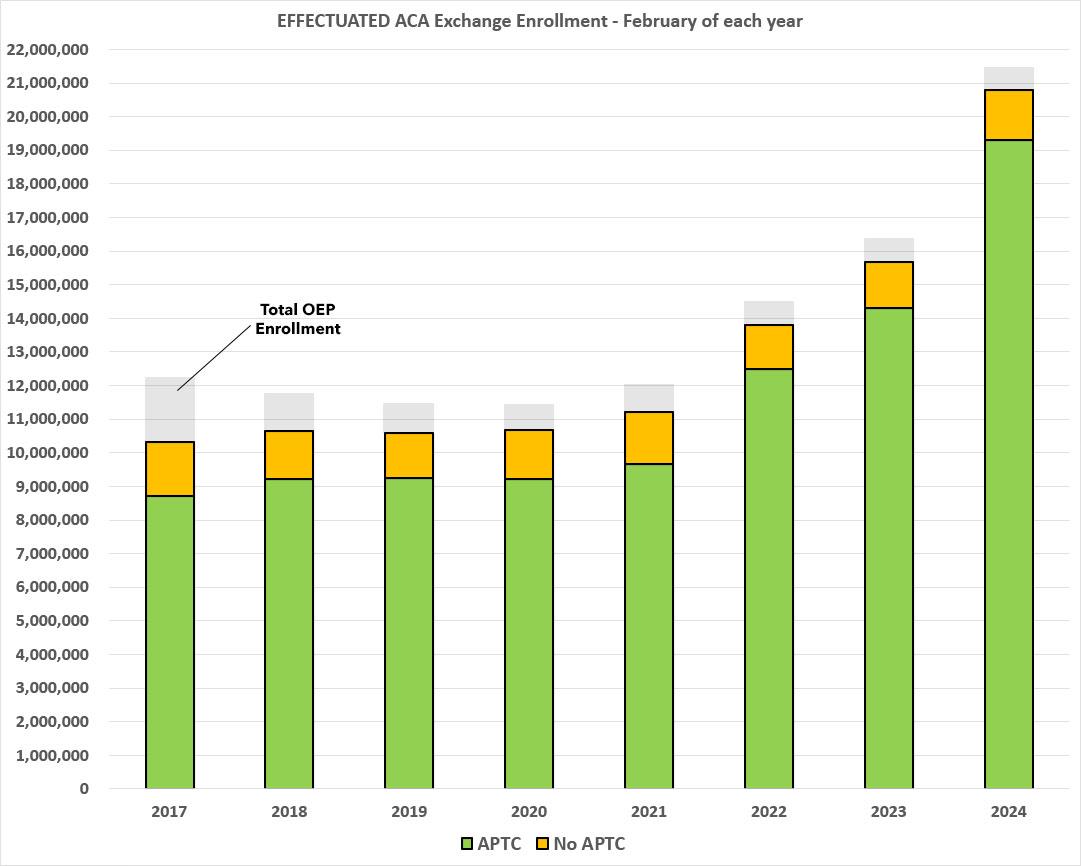
In any event, today's Effectuated Enrollment report makes it clear that the enhanced ARP/IRA subsidies + Silver Loading have indeed increased not only total enrollment, but also the effectuation percent of those enrollees:
This report provides effectuated enrollment, premium, advance payments of the premium tax credit (APTC), and cost sharing reduction (CSR) data for the Federally facilitated and State-based Marketplaces (the Marketplaces) for February 2024 and for the entire 2023 plan year, as of March 15, 2024.
Effectuated enrollment reflects the total number of people with active policies at any point within the given time period who also paid their premium, if applicable.
Key findings from this report include:
February 2024 Effectuated Enrollment, Financial Assistance, and Premiums
- Effectuated Enrollment: Effectuated enrollment through the Marketplaces for February 2024 was 20.8 million. This is a 33 percent increase compared to the 15.7 million consumers who had effectuated coverage in February 2023. The increased coverage over this period reflects continued impacts of the APTC expansion provided by the American Rescue Plan (ARP) and the Inflation Reduction Act (IRA). This represents 97 percent of consumers who made plan selections during the 2024 Open Enrollment Period (21.4 million).
Boom: 97%.
Now, there is one important caveat to this: This doesn't necessarily mean that all 20.8M are the same people who enrolled during the Open Enrollment Period itself. Due to the nature of the ACA and Special Enrollment Periods, a small number of those effectuated as of February were people who enrolled via SEP & replaced others who only enrolled for one month before dropping their coverage.
This is likely a nominal number as of February, though of course it grows throughout the year as current enrollees drop coverage for one reason or another and others sign up via SEPs (especially via the Medicaid Unwinding process, for example).
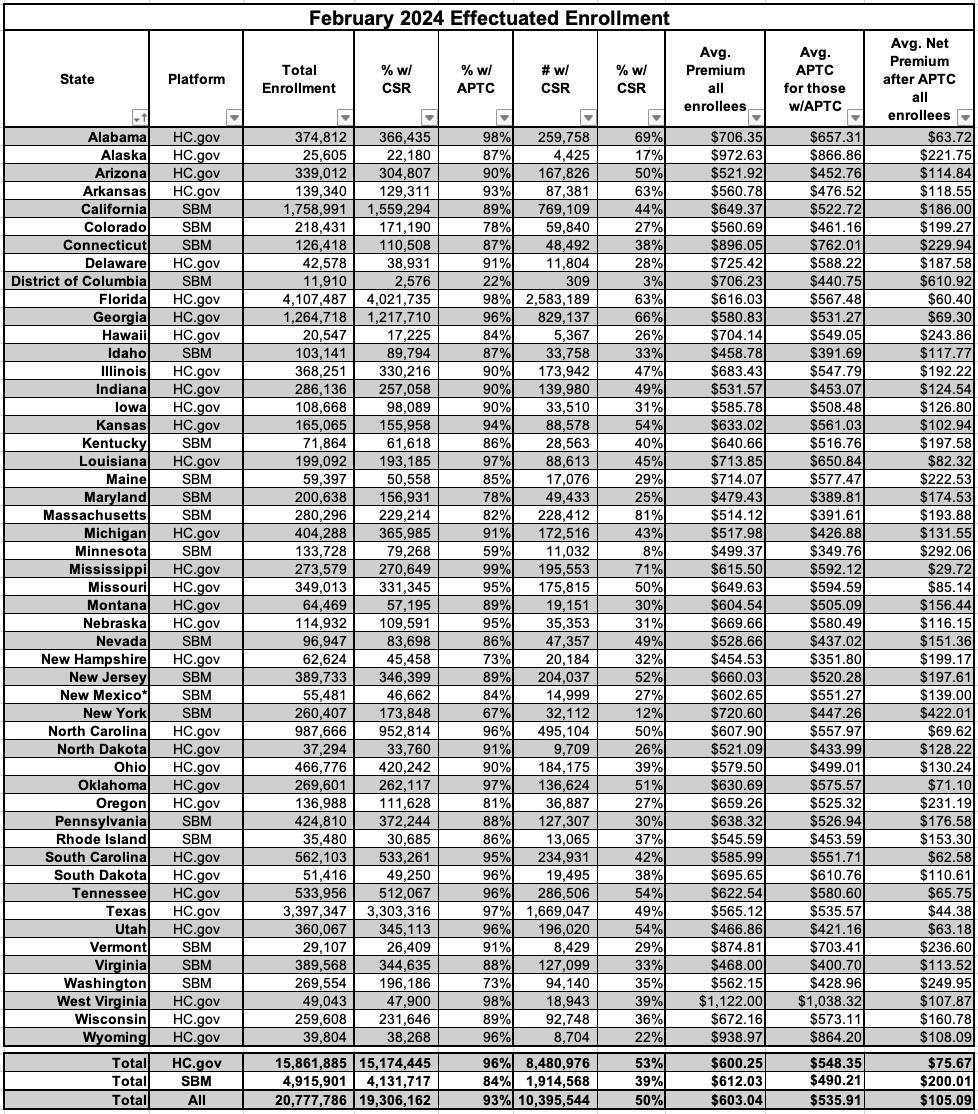
- Financial Assistance: In February 2024, 19.3 million Marketplace enrollees, or 93 percent of total Marketplace enrollees, received APTC, a 35 percent increase from the 14.3 million enrollees who received APTC in February 2023. Additionally, CSR enrollment increased by 37 percent from 7.6 million consumers in February 2023 to 10.4 million consumers in February 2024.
APTC = Advance Premium Tax Credits. This is primarily thanks to the ARP/IRA subsidy expansion, although some of it is also thanks to Silver Loading in some states. CSR = Cost Sharing Reduction assistance.
- Premiums: The average total monthly premium before APTC for Marketplace enrollees in February 2024 was $603.04, compared to $604.78 for February 2023. The average premium per month paid by consumers after APTC fell by $19 from $123.69 in February 2023 to $105.09 in February 2024.
Let me repeat that: Average unsubsidized premiums dropped year over year (only by $1.74 per person per month, but this is still surprising given all the fuss over inflation the past couple of years). Average premiums after subsidies were applied dropped more significantly, by 15%.
As noted above, the report also provides a full-year analysis of 2023 ACA exchange enrollment:
2023 Average Monthly Effectuated Enrollment, Financial Assistance, and Premiums
Effectuated Enrollment: A monthly average of 16.2 million consumers effectuated enrollment through the Marketplaces in the 2023 plan year. This is a 20 percent increase from the average monthly effectuated enrollment of 13.5 million in the 2022 plan year.
Financial Assistance: 92 percent of Marketplace enrollees received APTC on average each month in 2023. This represents a 2-percentage point increase from 90 percent in 2022.
Premiums: The average total monthly premium for Marketplace enrollees in 2023 was $593.15, compared to $580.79 in 2022.
So how does 2023 compare to prior years? Well, for February Effectuations vs. OEP QHP Selections, CMS has also provided a spreadsheet which breaks this out by state and year. Nationally, it comes out at:
- 2014: n/a (OEP didn't even end until mid-April)
- 2015: unknown; estimated 80-85%
- 2016: 84.4%
- 2017: 84.6%
- 2018: 90.6%
- 2019: 92.4%
- 2020: 93.4%
- 2021: 93.5%
- 2022: 95.2%
- 2023: 95.8%
- 2024: 96.9%
Note that the net effectuation rate has increased every year since the first Open Enrollment Period.
Advertisement