
Massachusetts: Preliminary unsubsidized avg. 2025 #ACA rate changes: +8.4% (fully weighted, merged market)
Mon, 06/24/2024 - 2:15pm
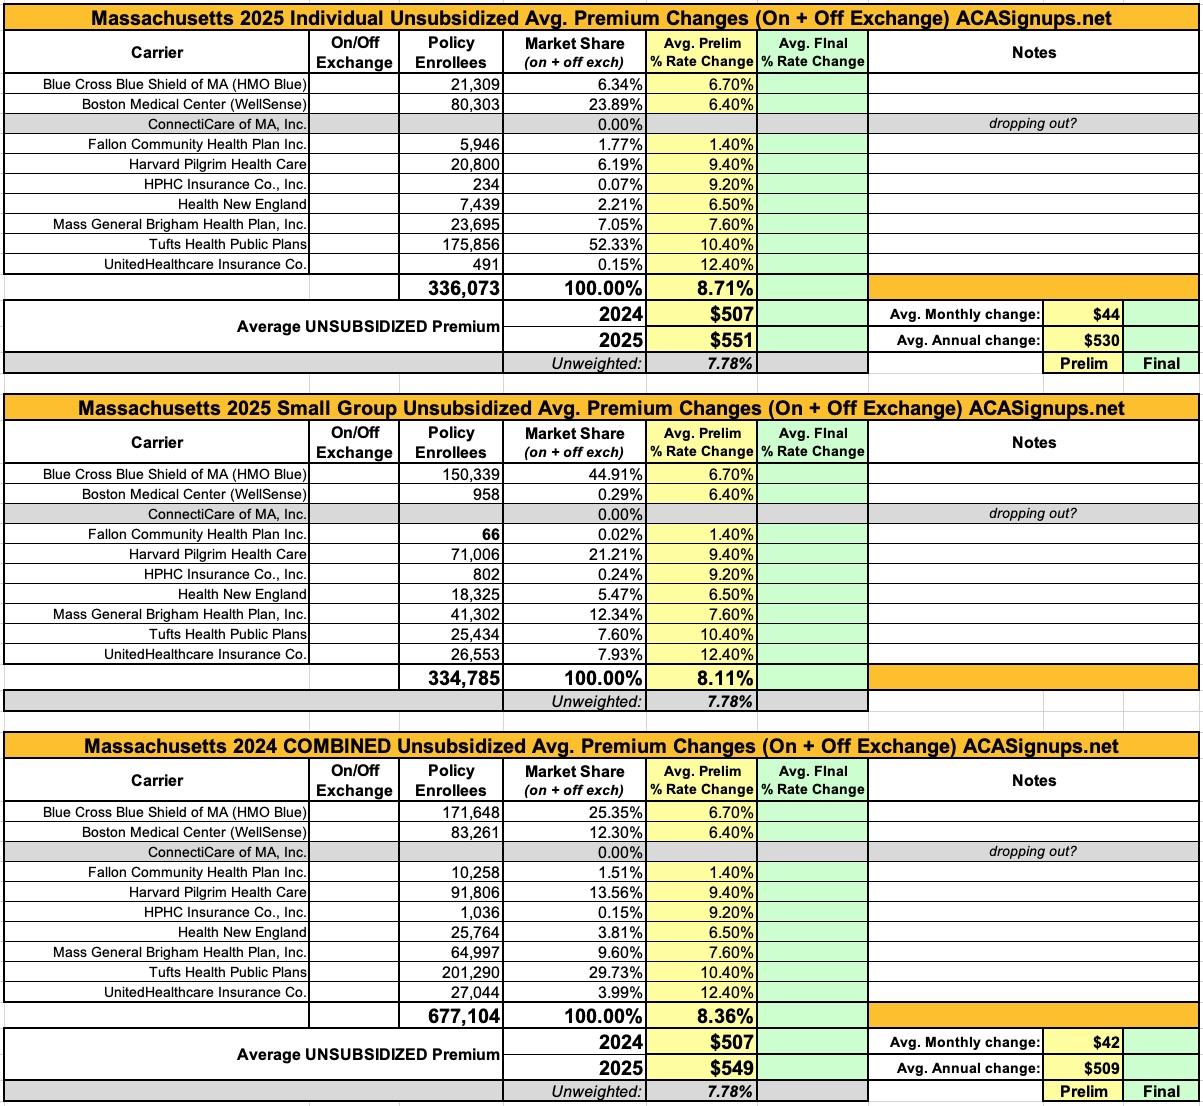
Massachusetts, which is arguably the original birthplace of the ACA depending on your point of view (the general "3-legged stool" structure originated here, but the ACA itself also has a lot of other provisions which are quite different), has 9 different carriers participating in the individual market in 2025. This is down from ten this year--ConnectiCare appears to be dropping out of the Massachusetts market.
One thing which sets Massachusetts (along with Vermont) apart from every other state is that their Individual and Small Group risk pools are merged for premium setting purposes.
Normally you would think this would make my job easier, since I only have to run one set of analysis instead of two...but until recently, it was surprisingly difficult to get ahold of exact enrollment data for each carrier on the merged Massachusetts market (and even more difficult to break out how many are enrolled in each market since they're merged...not that that's relevant to the actual rate changes).
Fortunately, starting last year, they've started posting fully-detailed breakout of all of this, including the filings, public narrative/justifications, actuarial memos and so on...and even a breakout of how many enrollees are in the individual vs. small group market policies!
It's possible that this detailed breakout has been available all along and I just didn't find it until now, but regardless, it makes my data nerd heart sing to see it!
I've broken the data out into the three tables below. The list of carriers and requested rate changes are the same for all three, but the first only includes individual market enrollees, the second only includes small group market enrollees, and the third is the combined, fully weighted average (which is the key number to use for my purposes).
Overall, Massachusetts has around 336,000 indy market enrollees and another 335,000 residents in small group plans. The combined, weighted average rate increase the carriers are seeking is 8.4% (+8.7% in the indy market; +8.1% for small group enrollees).
From some of the consumer summaries:
- All health plans are required by state and federal law to spend a percentage of the revenue they receive in premiums on the care of their members (versus on administrative costs or for reserves/surplus). In Massachusetts, we have the most rigorous requirements in the nation, whereby at least 88 cents of every premium dollar must be spent on our members’ care. Over the past 9 years, BCBSMA has delivered an average of 89 cents of our merged market premium dollar to our members’ care.
- As recent state reports have found, hospital and pharmaceutical costs continue to be the two largest categories of medical spending increases across Massachusetts. More than half of total medical expense trend is driven by increases in provider reimbursements. The effects of inflation and labor shortages have led to large price increase requests from healthcare providers. Additionally, more than 25% of total medical expense trend is driven by pharmaceutical costs. The impact of blockbuster high-cost biologics, GLP-1 weight loss drugs, and other innovative emerging therapies has a material impact on current trend. These dynamics put added pressure on medical claims, which in turn causes premiums to increase.
- There are several other factors that drive medical spending, including the use of inpatient and outpatient services, an aging population, and the increased cost of prescription medications (especially specialty drugs).
- We remain committed to keeping premiums as low as possible in a highly competitive marketplace while investing in new technology and services to deliver an even better experience for our members. We are working tirelessly in partnership with hospitals and physicians across the state to moderate the growth in health care costs and make quality care accessible for all.
- Projected higher annual trend: Overall trends are projected to be higher driven by pharmacy trend and increasing provider cost trend.
- The high pharmacy trend is driven by increased usage of brand and specialty drugs, such as on- and off-label use of GLP-1 for diabetes and weight loss, and newly approved high cost cell/genes therapies.
- Wellsense has a higher provider cost trend based on rate increases from completed and on-going negotiations, as well as any planned or estimated increases and adjustments to provider contracts. The network expansion required by the 2024 Connector’s SOA to offer the same wide network across all metal tiers has also contributed to higher provider cost trends.
- The anticipated increase in state assessment: Currently proposed assessment PMPM for the Health Safety Net, Pediatric Immunization Program, Behavioral Health Trust Fund, Center for Health Information and Analysis, Health Policy Commission, and MA Child Psychiatry Access Program has raised the rate by an additional 1.8%.
- Member mix changes: The ConnectorCare program has expanded to include individual whose income falls within 300% to 500% of the Federal Poverty Level (FPL). This expansion has driven more membership to be eligible for State subsidy and has helped to reduce the rate by 1.2%.
- 7.8% rate increase due to trend
- 0.6% rate increase due to retention as a percent of premiums primarily caused by the Exchange User Fee
- 3.7% rate increase due to the risk adjustment transfer, and
- 8.1% rate decrease due to improvement in the underlying experience.
- Trend: A key driver of health insurance premium increases year-over-year is medical trend, which is comprised of inpatient, outpatient, and physician services as well as pharmacy costs. Medical trend includes both increases in the cost of the services provided by hospitals and physician groups and increases in the utilization of these services by our members.
- In particular, for 2025, Harvard Pilgrim expects upward pressure on medical unit cost increases, driven primarily by the higher inflationary environment. While Harvard Pilgrim expects to successfully manage these unit cost increases, they are expected to be above recent levels. Additionally, pharmacy trends continue to put upward pressure on overall claim trend, and this is expected to continue in 2025.
- Health insurance premiums reflect the cost and usage of medical care and services. Health New England (HNE) has been impacted by increases in these areas due to higher costs and utilization of medical services and prescription drugs. As a result our medical and pharmacy trends used in premium rate development to project costs for inpatient and outpatient hospital-based care, physician services, and prescription drug costs, continue to rise.
- The largest driver of HNE’s 2025 requested rate increase is a rise in the costs of medical services and drugs. Pharmacy costs are expected to increase by 10.2% in 2025. This increase is driven by increased use of specialty drugs and the growth of new therapies. Members are also expected to use 2.5% more prescription drugs in 2025.
- Physicians and hospitals are facing economic pressures caused by supply chain shortages, overall inflation and continued workforce challenges. As a result, providers are seeking higher reimbursement for their services. HNE continues to be diligent but is routinely required to increase service reimbursement rates at levels that exceed the 3.6% cost control benchmark, established by the MA Health Policy Commission, in order to maintain its current provider network.
- Hospital services are expected to be 4.3% more expensive in 2025 and the use of those services is expected to grow 1-2%.
Advertisement