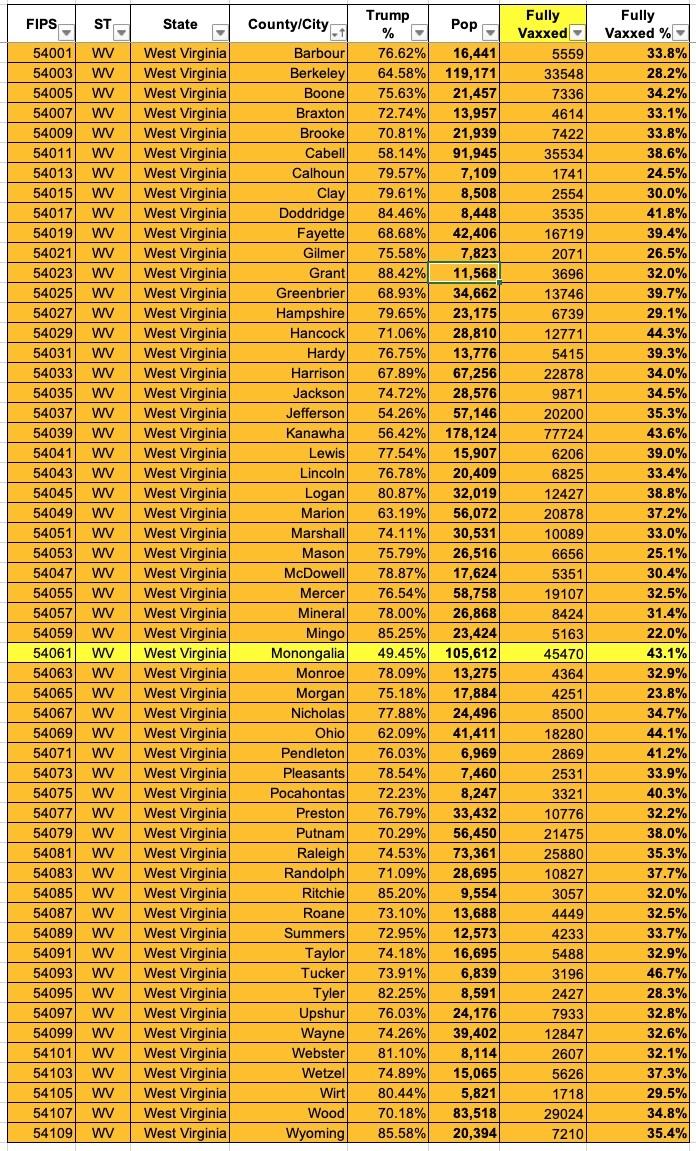
West Virginia: #COVID19 vaccination rates by county & partisan lean
Now that I've developed a standardized format/layout & methodology for tracking both state- and county-level COVID vaccination levels by partisan lean (which can also be easily applied to other variables like education level, median income, population density, ethnicity, etc), I've started moving beyond my home state of Michigan.
Here's Oklahoma:
- 2020 Presidential Election results via WV Secretary of State's office (thru Wikipedia)
- Vaccination data via COVID Act Now database
NOTE: The CDC lists ~279,000 West Virginia residents (a whopping 84.4% of the total fully vaccinated) whose county of residence is unknown, which would make the graphs below unusable. Fortunately, the COVID Act Now database appears to have acquired the actual county-level data directly from the West Virginia Health Dept, so I'm using their data instead for WV.


