CONFIRMED: ~2/3 of requested 2018 individual market rate increases due SPECIFICALLY to Trump/GOP sabotage.
Regular readers know that I've spent the past 4 months painstakingly tracking and analyzing the 2018 individual market rate filings for pretty much every insurance carrier in every state across the country.
I've completed this process for 46 states + DC. I've confirmed (well, really, Louise Norris confirmed for me) that the filing data for the four missing states--Kansas, Missouri, Nevada and Utah--won't be made available publicly for another couple of weeks, which is irritating...but those four states combined only make up about 5% of the total population anyway; unless their average rate increase requests are significantly higher (or lower) than the average of the rest of the states, they aren't gonna move the needle up or down by more than a tenth of a point or so.
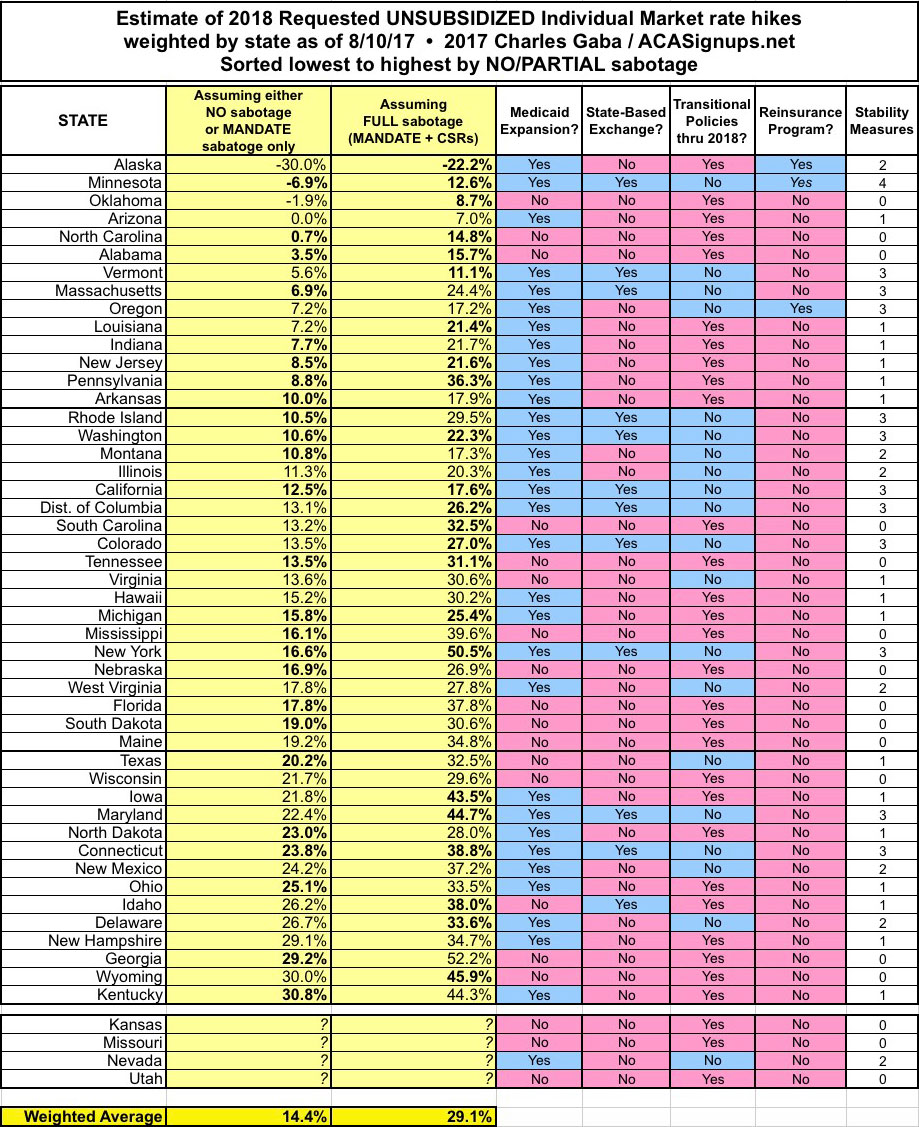
The details, caveats, disclaimers and methodology behind my estimates can all be found here, and of course the averages vary widely from state to state, carrier to carrier and even plan to plan. Also, many of these requests will change by the time the 5th Open Enrollment Period starts on November 1st, due to additional shuffling of carriers dropping out or expanding coverage, resubmitting filings, having their requests changed by state insurance regulators and so on. NATiONALLY, however, this is what it looks like. Bold-faced numbers mean I'm highly confident in the weighted average; non-bold means I'm reasonably confident but there's considerable margin for error:

Yes, that's right: Overall, nationally, carriers are asking for around a 29% average rate hike assuming CSR payments aren't guaranteed for 2018 and the individual mandate penalty isn't enforced...or around 14% assuming that CSR payments are guaranteed. As noted above, it's more difficult to separate out the individual mandate threat because most of the filing justification letters either don't mention it at all or only refer to it in vague terms ("increased morbidity expected due to changes in federal policy", etc.)...but there are some major carriers which have indeed specifically called it out and even attached a hard number to the impact.
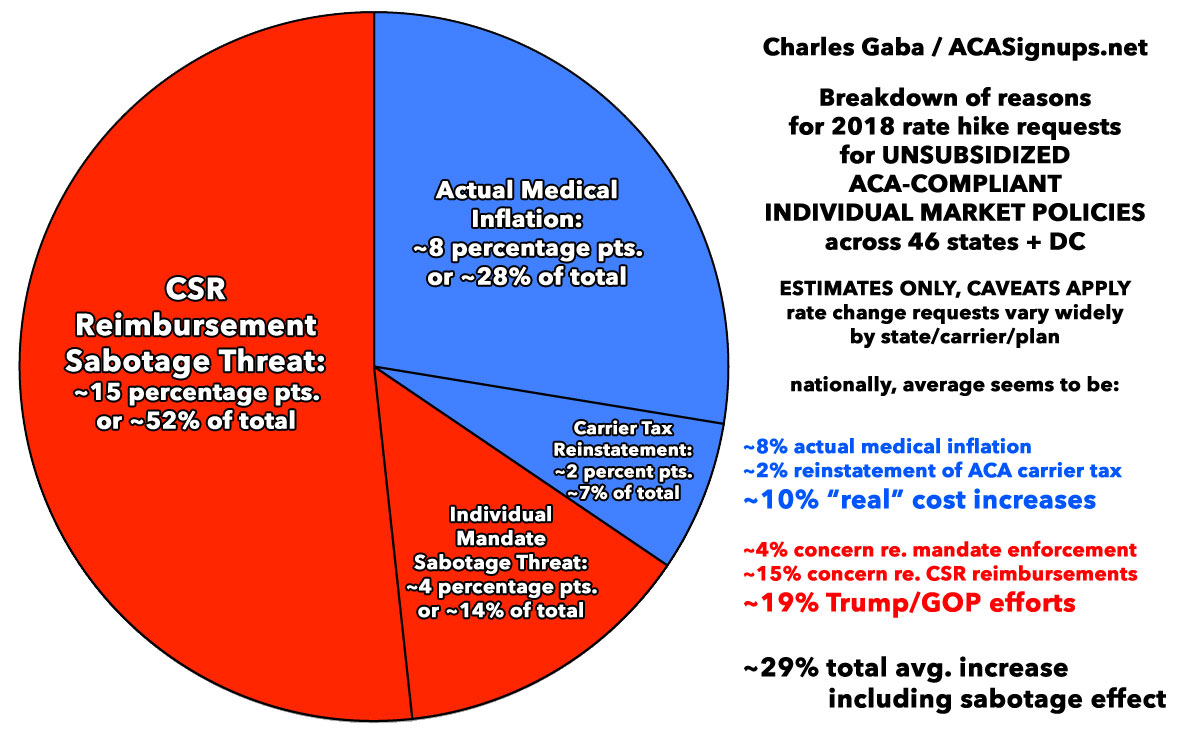
Overall, to the best of my judtgment, the national picture looks very close to the following: Roughly 19 percentage points, or around 2/3 of the total, is due to either the CSR Payment or Mandate Enforcement factors, with the remaining 10 points (around 1/3 of the total) due to actual increased cost of medical services (including prescription medications), as well as the reinstatement of the ACA's carrier tax:

So, what sort of impact do various major factors have on the rate increases? Well, last year there was a pretty definite pattern: States which expanded Medicaid, ran their own exchanges and which didn't offer transitional policy enrollment extensions averaged 11.6% lower rate increases than states which didn't expand Medicaid, didn't run their own exchanges and did offer transitional policies.
This year, I'll still have to plug the numbers in to get the weighted averages (which is made even more complicated by the CSR sabotage factor), but it looks like any patterns will be harder to parse out. Here's what the states look like from lowest to highest using the "No/Partial" sabotage or "FULL" sabotage numbers, with Medicaid Expansion, State Exchanges, Transitional Policies and Reinsurance Programs. The only obvious pattern so far is that yes, a reinsurance program does make a huge difference in cutting down average premiums:


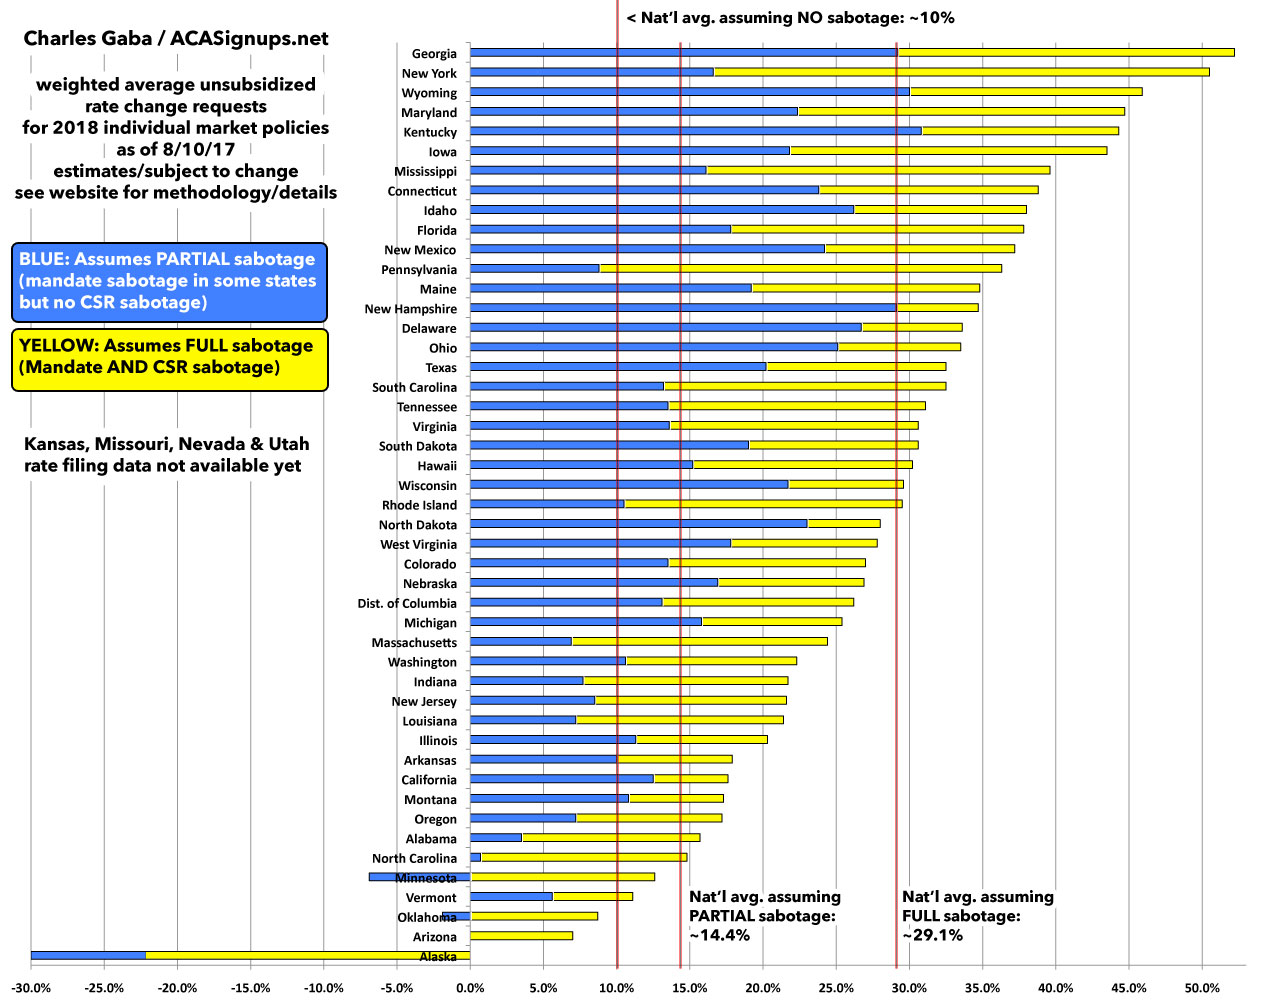
Here's what the averages look like from worst to best in bar graph format:


