Holy Crap. how much DOES an international financial services corporation equity researcher earn in a year, anyway?
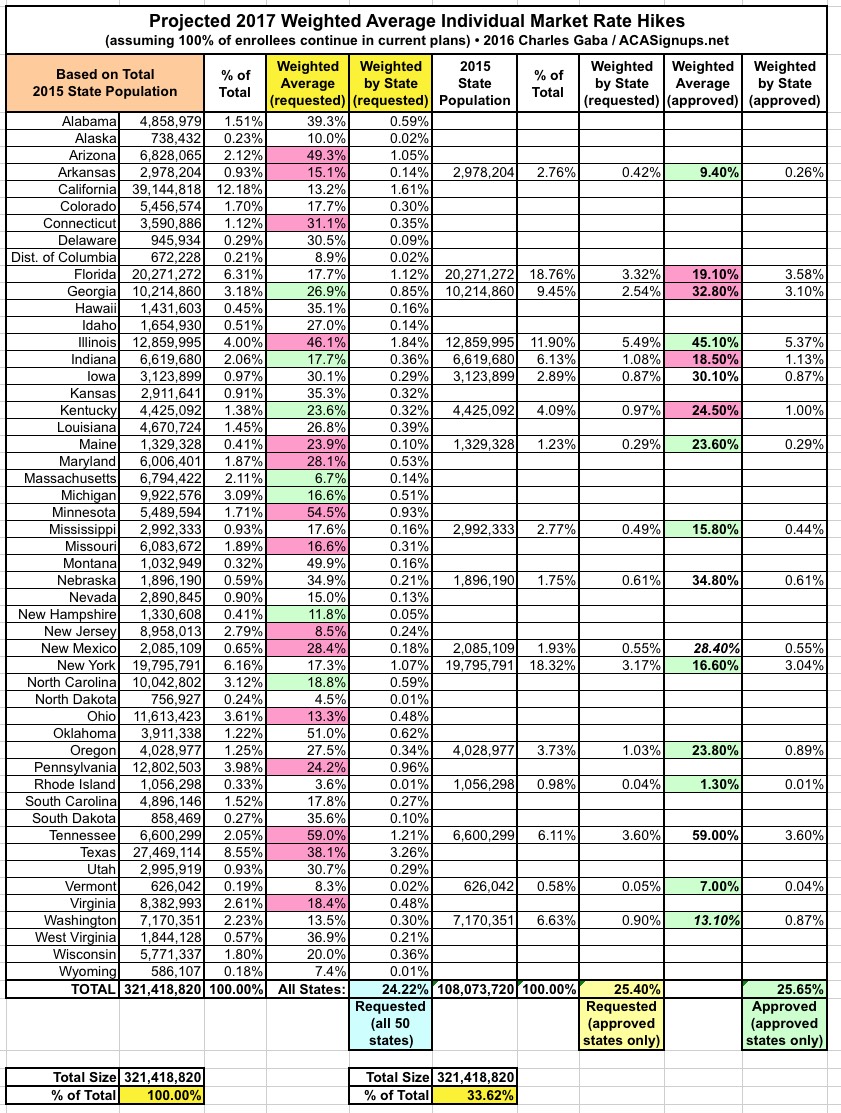
This is my official Projected 2017 Weighted Average Individual Market Rate Hike spreadsheet. While the specific state data (requested) has changed slightly, it's still virtually identical to the data I posted back on August 8th:

Regular readers know I’ve been working on this project since all the way back in early May, making revisions and tweaks along the way. Ever since I plugged in the bulk of the states, my estimated national average has ranged between 23-25% (it moves around a little here and there as new data is entered, carriers enter or leave markets/states and as revised filing requests are submitted to the state insurance depts), and my estimate has been cited/referenced in several dozen major publications across the ideological spectrum, including The Economist, Forbes, USA Today, Zero Hedge, Slate and so on.
However, even after running the site for nearly 3 years, I still sometimes make mistakes, and being used as the source for this particular data point still makes me a bit nervous at times...what if it turns out I’m way off base? That 23-24% estimate is driving a lot of the current “Obamacare Dooooooomed!!” narratives at the moment...and it’s playing out right as the Presidential (and Congressional...and Senate) campaign is going into the home stretch.
Well, today I received some news which, while not positive from an ACA supporter POV, is at least reassuring on a personal level.
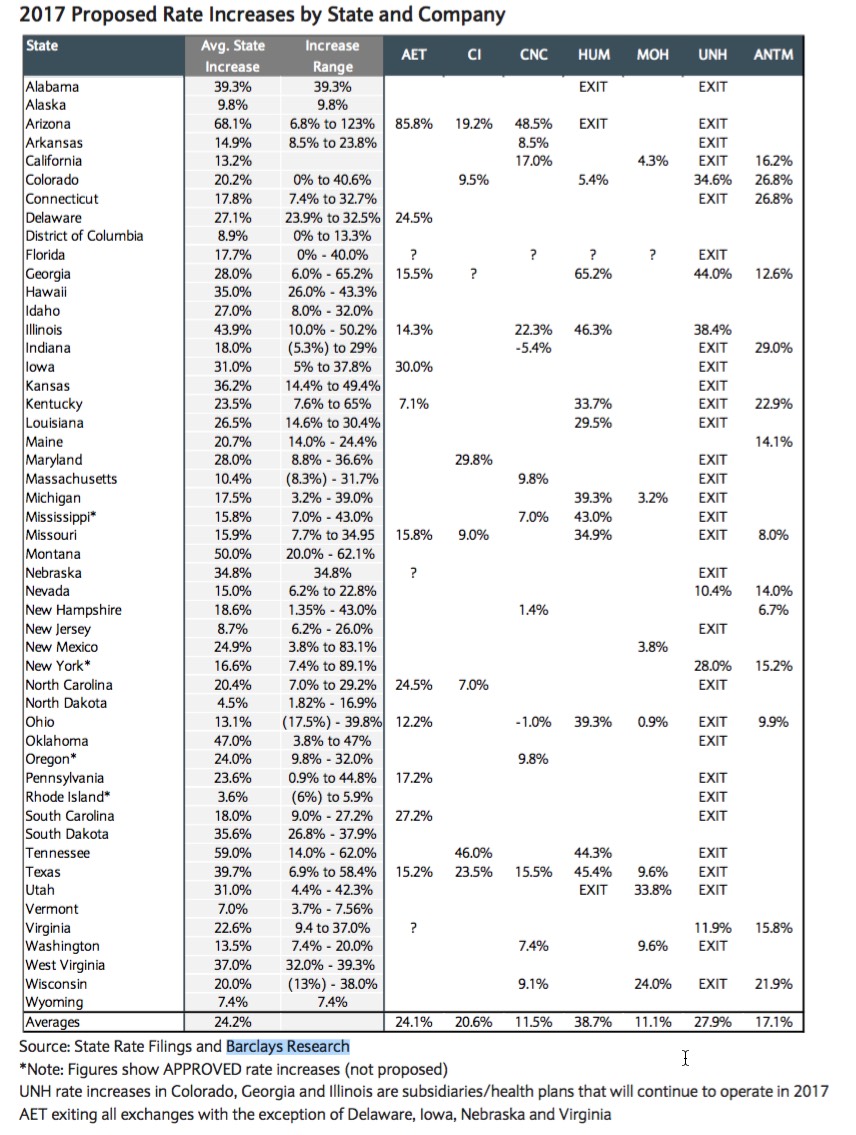
I present Page 8 of the Barclays U.S. Health Care-Managed Care 2Q16 Review: Deep Dive on Exchanges Equity Research Paper (PDF):

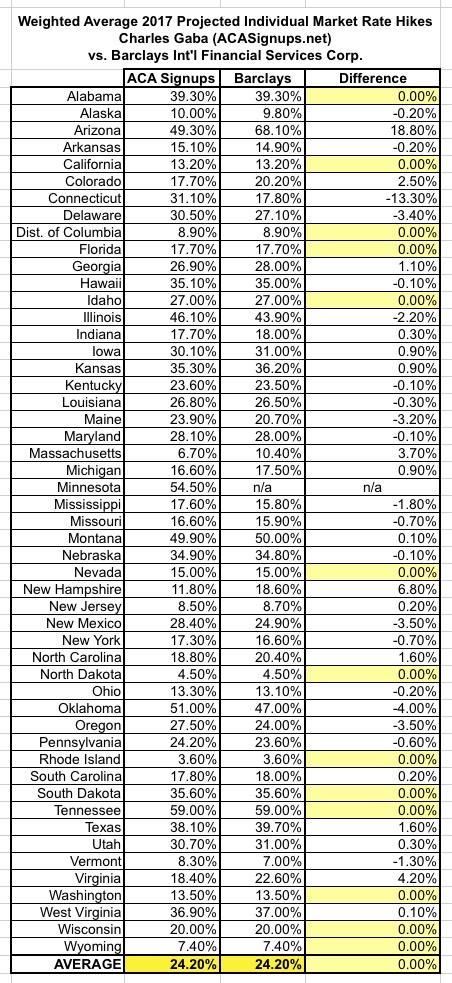
I know the numbers can be a bit tricky to separate out from the other columns, so I’ve re-entered the state/national estimates from both myself and Barclays side by side:

Good heavens.


